Plotting Quadratic Equations
These topics are covered in the Mathematics syllabus in preparation for the University of Malta MATSEC O level exam. However a strong knowledge of such topics will prove to be extremely important and useful for the workings in the A level topics. These topics are intended as a revision and brush-up for students starting their A level Pure Mathematics in Malta.
Quadratic equations have the following form:
where a,b and c are some numbers. However a must not be zero (a\neq 0). In fact, if a where 0, the equation above becomes y=bx+c which is the equation of a straight line and not a quadratic. The following are examples of quadratic equations:
In quadratic (1), we have a=1, b=3 and c=-1. In quadratic (2), we note that the term in x is missing (i.e. b=0). Still this is a quadratic equation because the term in x^2 is present. Similarly in quadratic (3), the constant term is missing (i.e. c=0). Still this remains a quadratic equation because the term in x^2 is present. Finally, quadratic (4) is a quadratic because when we expand (open up) the brackets we obtain y=x^2-2x+1 and this has the term in x^2 present.
The two different shapes of the quadratic equation
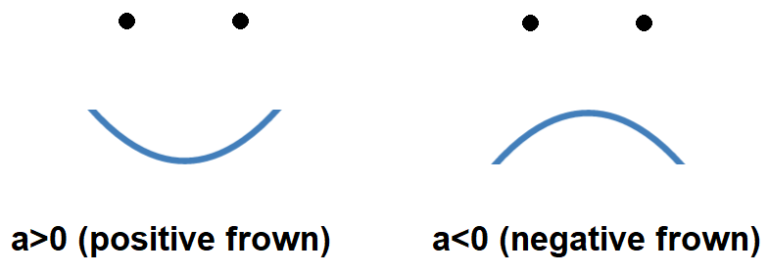
There are two different shapes that a quadratic equation can take, when plotted. The first shape is the U-shape where the quadratic has the shape of the letter “U” and the second shape is the N-shape where the quadratic has the shape of the letter “n”. The shape of the quadratic equation y=ax^2+bx+c is determine only by the coefficient of x^2. If a>0, the quadratic is U-shaped. If a<0, the quadratic is N-shaped. The following diagram helps you remember this rule.
Example: Determine the shape of the following quadratics:
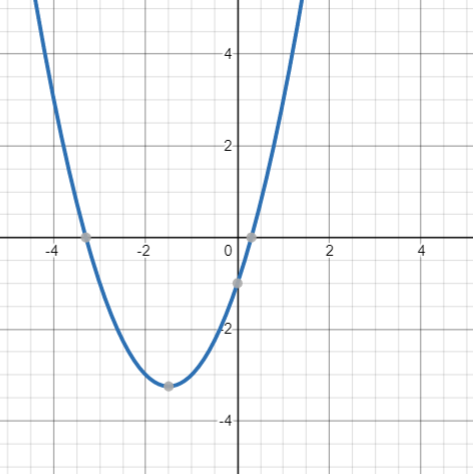
(a) y=x^2+3x-1
We have a=1, thus a>0. So the quadratic is U-shaped. In fact the plot of this quadratic is the following:
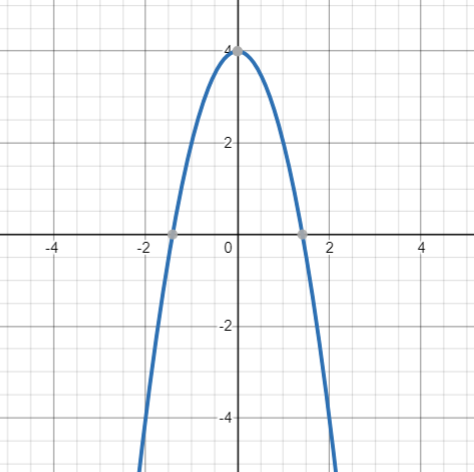
(b) y=-2x^2+4
We have a=-2, thus a<0. So the quadratic is N-shaped. In fact the plot of this quadratic is the following:
(c) y=(x-1)^2
Let us expand this quadratic equation:
We have a=1, thus a>0. So the quadratic is U-shaped. In fact the plot of this quadratic is the following:
(b) y=-(x+1)^2
Let us expand this quadratic equation:
We have a=-1, thus a<0. So the quadratic is N-shaped. In fact the plot of this quadratic is the following:
Plotting Quadratic Equations
We will plot quadratic equations by using just 3 steps as follows:
Step 1: We find the x-intercept(s) (also known as the root(s)). This is done by letting y=0 in the equation, factorising the quadratic and solving for x.
Step 2: We find the y-intercept (the point where the graph crosses the y-axis). This is done by letting x=0 in the equation and solving for y.
Step 3: We check whether the curve is U-shaped or N-shaped and draw a curved line through the x-intercept(s) and the y-intercept. Note that the graph reaches its minimum/maximum point exactly between the roots.
A note regarding the x-intercept(s): We will have either two different x-intercepts, or just one distinct x-intercept or else no x-intercepts. The case where we have no x-intercepts will be discussed in more details in the A-level topic on Differentiation.
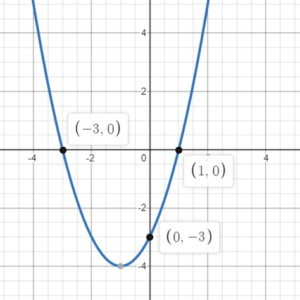
Example 1: Plot the following equation: y=x^2+2x-3
In Step 1, let y=0,
Therefore the roots are (-3,0) and (1,0)
In Step 2, we let x=0,
Therefore the y-intercept is (0,-3). We draw a curve through the roots and the y-intercept that is symmetric between the roots. Note that since a>0, the curve will be U-shaped.
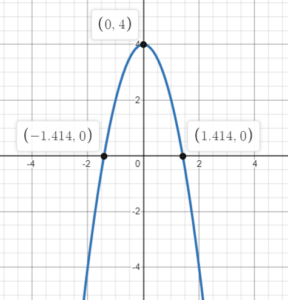
Example 2: Plot the following equation: y=-2x^2+4
In Step 1, let y=0,
Therefore the roots are (-\sqrt{2},0) and (\sqrt{2},0)
In Step 2, we let x=0,
Therefore the y-intercept is (0,4). We draw a curve through the roots and the y-intercept that is symmetric between the roots. Note that in this example, a=-2>0, hence the curve will be N-shaped.
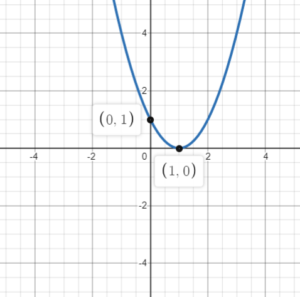
Example 3: Plot the following equation: y=(x-1)^2
In Step 1, let y=0,
Note that here we have just one distinct root (in other words, a repeated root) which is given by the coordinates (1,0).
In Step 2, we let x=0,
Therefore the y-intercept is (0,1).
For Step 3, let us expand the quadratic in order to determine its shape.
Since a=1>0, the curve will be U-shaped. We draw a U-shaped curve passing through the root and the y-intercept.
Summary
We have learnt how to plot a quadratic equation in 3 simple steps. In Step 1, we find the x-intercepts (roots), in Step 2, we find the y-intercept and finally in Step 3, we determine the shape of the quadratic (U-shape or N-shape) and plot the curve.
Note that in the case of a quadratic equation that has no roots (no x-intercepts), we need to find the minimum or maximum point in order to be able to get a decent plot. However this case will be covered in the topic of Differentiation.
Exercises
Plot the following quadratic equations:
a) y=x^2-x
b) y=4-x^2
c) y=x^2
d) y=x^2+4x+4
e) y=2x^2-2x+\frac{1}{2}
f) y=2(x+1)(x+4)