Plotting Straight Lines
These topics are covered in the Mathematics syllabus in preparation for the University of Malta MATSEC O level exam. However a strong knowledge of such topics will prove to be extremely important and useful for the workings in the A level topics. These topics are intended as a revision and brush-up for students starting their A level Pure Mathematics in Malta.
The equation of the straight line is given by the formula:
y=ax+b for some numbers a and b.
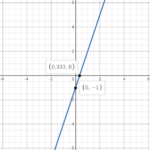
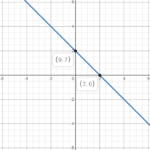
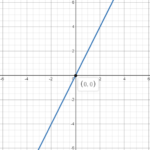
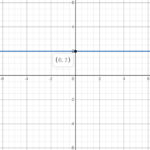
The following are examples of straights lines:
Line (3) results when the value of b is 0. In fact the equation could have been written as y=2x+0. Line (4) results when the value of a is 0. In fact the equation could have been written as y=0x+2.
In what follows we consider four cases of the straight line and learn how to plot the straight line in each case.
Case 1: y=ax+b where a \neq 0 and b \neq 0
We plot this line in 3 steps:
Step 1: We let y=0 in order to find the x-intercept (the root), which is the point where the line crosses the x-axis.
Step 2: We let x=0 in order to find the y-intercept, which is the point where the line crosses the y-axis.
Step 3: Then we draw the line passing through the x-intercept (the root) and the y-intercept.
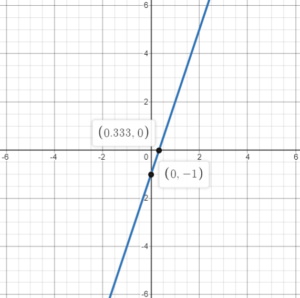
Example 1: Plot the line y=3x-1
In Step 1, let x=0 in the equation of the line:
We obtain the point (0,-1).
In Step 2, let y=0 in the equation of the line and make x subject of the formula:
We obtain the point (\frac{1}{3},0).
In Step 3, we take the points (0,-1) and (\frac{1}{3},0), plot them and draw a line through them.
Example 2: Plot the line y=-x+2
In Step 1, let x=0 in the equation of the line:
We obtain the point (0,2).
In Step 2, let y=0 in the equation of the line and make x subject of the formula:
We obtain the point (2,0).
In Step 3, we take the points (0,2) and (2,0), plot them and draw a line through them.

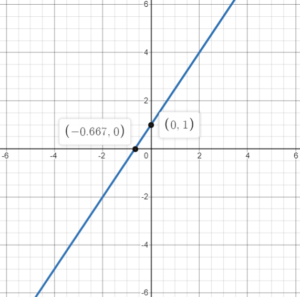
Example 3: Plot the line 2y=3x+2
Although here the coefficient of y is not 1 (equal to 2 in this example), we still carry out the usual three steps in order to plot this line. In Step 1, let x=0 and make y subject of the formula:
We obtain the point (0,1).
In Step 2, let y=0 in the equation of the line and make x subject of the formula:
We obtain the point (-\frac{2}{3},0).
In Step 3, we take the points (0,1) and (-\frac{2}{3},0), plot them and draw a line through them.
Case 2: y=ax where a \neq 0
In this case, there is no constant term in the equation of the line. We do have a term in x and a term in y but the constant term is missing. This line always passes from the origin (0,0), because if you put x=0 in the equation, you always get y=0. So we already know one point that lies on the line. We plot this line in 2 steps:
Step 1: We let x be some non-zero value, for example x=1 and find the corresponding value of y.
Step 2: Then we draw the line passing through the origin (0,0) and the point found in Step 1.
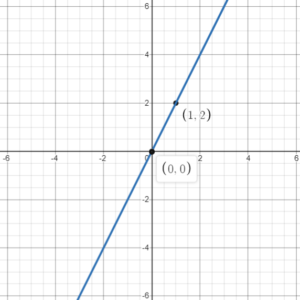
Example 1: Plot the line y=2x
Notice that in the equation of this line, there is no constant term. We just have a term in x and a term in y. So the origin (0,0) lies on the line. In Step 1, let x=1 and make y subject of the formula:
We obtain the point (1,2).
In Step 3, we take the points (0,0) and (1,2), plot them and draw a line through them.
Example 2: Plot the line -4y=2x
Notice that in the equation of this line, again there is no constant term. So we are dealing with the Case 2. So the origin (0,0) lies on the line. In Step 1, let x=1 and make y subject of the formula:
We obtain the point (1,-\frac{1}{2}).
In Step 3, we take the points (0,0) and (1,-\frac{1}{2}), plot them and draw a line through them.

Case 3: y=b for some number b
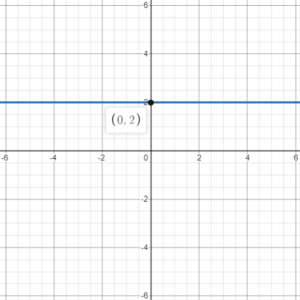
For any value of x, y is always equal to b. Hence this gives us a horizontal line with y-intercept equal to b. Another way to look at this is that we are after the all the points in the xy-plane whose y-value is equal to b. Again, this gives us a horizontal line with y-intercept equal to b.
Example 1: Plot the line y=2
Here we just plot a horizontal line with y-intercept equal to 2.
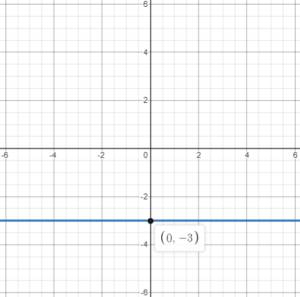
Example 2: Plot the line y=-3
Here we just plot a horizontal line with y-intercept equal to -3.
Case 4: x=c for some number c
Here we are after all the points in the xy-plane whose x-value is equal to c. This gives us a vertical line with x-intercept equal to c.
Example 1: Plot the line x=-1
We plot a horizontal line with x-intercept equal to -1.

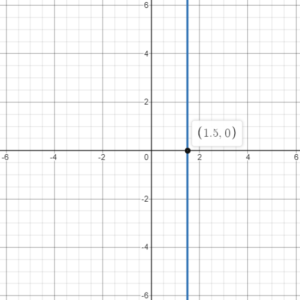
Example 2: Plot the line x=\frac{3}{2}
We plot a horizontal line with x-intercept equal to \frac{3}{2}.
Summary
We have learnt how to draw a straight line in four different case. In Case 1, we had the general straight line equation y=ax+b . In Case 2, we had lines with no constant term, that is, of the form y=ax. In Case 3, we considered lines of the form y=b for some number b and these are simply horizontal lines. In Case 4, we considered lines of the form x=c for some number c and these are simply vertical lines.
Exercises
Plot the following lines:
a) y=4x+2
b) y-3x=2
c) x+2y+1=0
d) y=\frac{1}{2}x
e) 2x-3y=0
f) y=\frac{1}{3}
g) y=0
h) x=-2
i) x=0
